


















Skip to content

Cincinnati Reds at San Francisco Giants

Game flow

SF100%50%100%CIN
123456789

Biggest lead SF by 3

Key plays

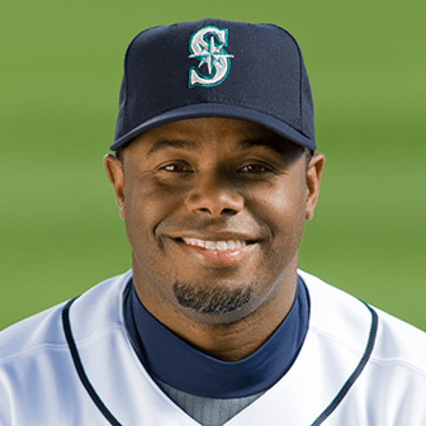
  • T3 +11% SFKen Griffey flies out to right fielder Randy Winn.CIN 0 · SF 0
  • B4 +13% SFPedro Feliz singles on a line drive to center fielder Ken Griffey. Mark Sweeney scores. Steve Finley to 3rd. Pedro Feliz to 2nd.CIN 0 · SF 1
  • B5 +10% SFRandy Winn doubles (28) on a fly ball to center fielder Ken Griffey. Randy Winn scores. Throwing error by center fielder Ken Griffey.CIN 0 · SF 2
  • T6 +11% CINDavid Ross homers (18) on a fly ball to left field.CIN 1 · SF 2
  • B7 +12% SFShea Hillenbrand homers (17) on a line drive to left center field. Omar Vizquel scores.CIN 1 · SF 4

Team stats

  • 6Hits8
  • 1Runs4
  • 1Home runs1
  • 3Walks5
  • 4Strikeouts7
  • 2Errors2
See more
  • .182Batting average.250
  • .250On-base %.351
  • .303Slugging.375
  • 4.50ERA1.00
  • 17Left on base17

2006 National League Standings

WLPCTGB
1NYMets9765.599—
2LADodgers8874.5439.0
3SDPadres8874.5439.0
4PHPhillies8577.52512.0
5STCardinals8378.51613.5
6HOAstros8280.50615.0
7CIReds8082.49417.0
8ATBraves7983.48818.0
9MIMarlins7884.48119.0
10SFGiants7685.47220.5
11AZD-backs7686.46921.0
12CORockies7686.46921.0
13MIBrewers7587.46322.0
14WSNationals7191.43826.0
15PIPirates6795.41430.0
16CHCubs6696.40731.0

Spray chart

Hover, tap or use the arrow keys to see each ball in play.

55 balls in play · 14 hits · filled is a hit, hollow is an out

Game info

Venue
Oracle Park, San Francisco, CA