


















Skip to content

Tampa Bay Devil Rays at Toronto Blue Jays

Game flow

TOR100%50%100%TB
123456789

Biggest lead TB by 2 · TOR by 2 · 2 lead changes

Key plays

  • T5 +26% TBJorge Velandia homers (2) on a fly ball to left center field. Josh Wilson scores.TB 2 · TOR 1
  • T5 +12% TBCarlos Pena homers (45) on a fly ball to right field.TB 3 · TOR 1
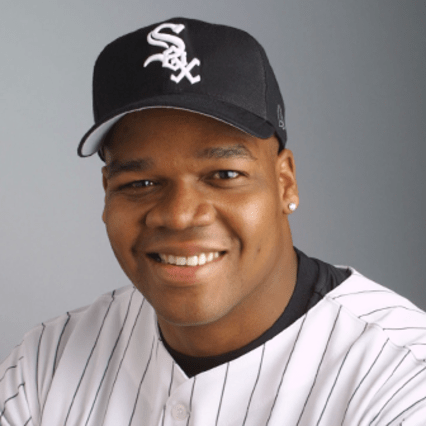
  • B6 +16% TORAaron Hill doubles (47) on a fly ball to center fielder Justin Ruggiano. Frank Thomas scores.TB 3 · TOR 3
  • B6 +16% TORAdam Lind homers (10) on a fly ball to right center field. Aaron Hill scores.TB 3 · TOR 5
  • T7 +13% TORCarlos Pena strikes out swinging.TB 4 · TOR 5

Team stats

  • 8Hits9
  • 4Runs5
  • 2Home runs2
  • 2Walks2
  • 11Strikeouts8
  • 1Errors1
See more
  • .222Batting average.290
  • .263On-base %.371
  • .417Slugging.613
  • 5.63ERA3.00
  • 17Left on base13

2007 AL East Standings

WLPCTGB
1BORed Sox9666.593—
2NYYankees9468.5802.0
3TOBlue Jays8379.51213.0
4BAOrioles6993.42627.0
5TBRays6696.40730.0

Spray chart

Hover, tap or use the arrow keys to see each ball in play.

48 balls in play · 17 hits · filled is a hit, hollow is an out

Strike zone

Hover, tap or use the arrow keys to see each pitch.
  • Ball
  • Called strike
  • Swinging strike
  • Foul
  • In play

Catcher's view. Count is after the pitch.

Game info

Venue
Rogers Centre, Toronto, ON