































Skip to content

Atlanta Braves at Seattle Mariners

Game flow

SEA100%50%100%ATL
123456789

Biggest lead ATL by 2

Key plays

  • T1 +10% ATLBrian McCann homers (14) on a fly ball to center field.ATL 1 · SEA 0
  • B4 +14% SEAAdam Kennedy homers (6) on a fly ball to right field.ATL 1 · SEA 1
  • B5 +8% ATLChone Figgins pops out to third baseman Julio Lugo in foul territory.ATL 1 · SEA 1
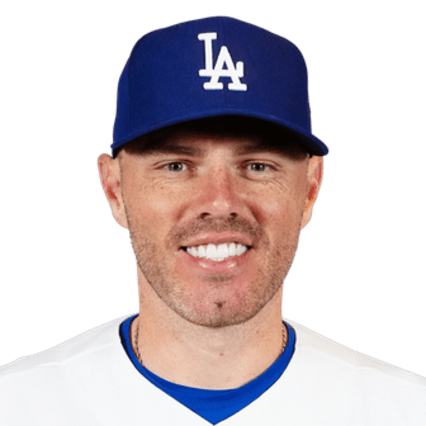
  • T7 +31% ATLFreddie Freeman homers (9) on a fly ball to center field. Brian McCann scores.ATL 3 · SEA 1
  • B7 +16% ATLFranklin Gutierrez grounds into a double play, shortstop Alex Gonzalez to second baseman Dan Uggla to first baseman Freddie Freeman. Mike Carp out at 2nd. Franklin Gutierrez out at 1st.ATL 3 · SEA 1

Team stats

  • 5Hits5
  • 3Runs1
  • 2Home runs1
  • 1Walks2
  • 5Strikeouts13
  • 0Errors1
See more
  • .156Batting average.161
  • .182On-base %.212
  • .375Slugging.290
  • 1.00ERA3.00
  • 7Left on base10

2011 Standings

National LeagueWLPCTGB
1PHPhillies10260.630—
2MIBrewers9666.5936.0
3AZD-backs9468.5808.0
4STCardinals9072.55612.0
5ATBraves8973.54913.0
6SFGiants8676.53116.0
7LADodgers8279.50919.5
8WSNationals8081.49721.5
9CIReds7983.48823.0
10NYMets7785.47525.0
11CORockies7389.45129.0
12MIMarlins7290.44430.0
13PIPirates7290.44430.0
14CHCubs7191.43831.0
15SDPadres7191.43831.0
16HOAstros56106.34646.0
American LeagueWLPCTGB
1NYYankees9765.599—
2TERangers9666.5931.0
3DETigers9567.5862.0
4TBRays9171.5626.0
5BORed Sox9072.5567.0
6LAAngels8676.53111.0
7TOBlue Jays8181.50016.0
8CLGuardians8082.49417.0
9CWWhite Sox7983.48818.0
10OAAthletics7488.45723.0
11KCRoyals7191.43826.0
12BAOrioles6993.42628.0
13SEMariners6795.41430.0
14MITwins6399.38934.0

Spray chart

Hover, tap or use the arrow keys to see each ball in play.

45 balls in play · 10 hits · filled is a hit, hollow is an out

Strike zone

Hover, tap or use the arrow keys to see each pitch.
  • Ball
  • Called strike
  • Swinging strike
  • Foul
  • In play

Catcher's view. Count is after the pitch.

Game info

Venue
T-Mobile Park, Seattle, WA