


























Skip to content

Atlanta Braves at San Francisco Giants

1
2
3
4
5
6
7
8
9
RHE
ATL000010000170
SF10014004—10140

Game flow

SF100%50%100%ATL
123456789

Biggest lead SF by 9

Key plays

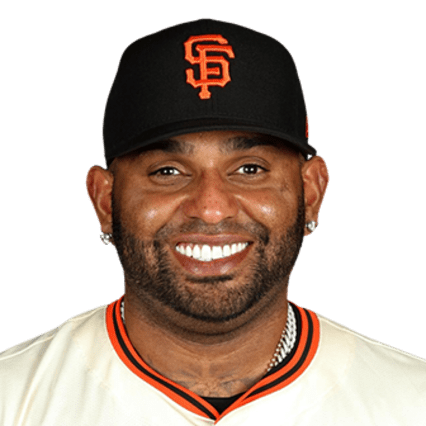
  • B1 +11% SFPablo Sandoval homers (5) on a line drive to left field.ATL 0 · SF 1
  • B4 +9% ATLFrancisco Peguero grounds into a double play, shortstop Andrelton Simmons to second baseman Dan Uggla to first baseman Freddie Freeman. Buster Posey to 3rd. Hunter Pence out at 2nd. Francisco Peguero out at 1st.ATL 0 · SF 1
  • B4 +10% SFBrandon Crawford doubles (8) on a line drive to left fielder Evan Gattis. Buster Posey scores. Guillermo Quiroz to 3rd.ATL 0 · SF 2
  • T5 +10% ATLPaul Maholm singles on a line drive to left fielder Francisco Peguero. Evan Gattis scores. B.J. Upton to 3rd.ATL 1 · SF 2
  • B5 +9% SFBuster Posey doubles (10) on a fly ball to right fielder Justin Upton. Marco Scutaro scores. Pablo Sandoval to 3rd.ATL 1 · SF 3

Team stats

  • 7Hits14
  • 1Runs10
  • 0Home runs1
  • 3Walks5
  • 12Strikeouts6
See more
  • .206Batting average.400
  • .270On-base %.488
  • .235Slugging.743
  • 11.25ERA1.00
  • 14Left on base15

2013 National League Standings

WLPCTGB
1STCardinals9765.599—
2ATBraves9666.5931.0
3PIPirates9468.5803.0
4LADodgers9270.5685.0
5CIReds9072.5567.0
6WSNationals8676.53111.0
7AZD-backs8181.50016.0
8SDPadres7686.46921.0
9SFGiants7686.46921.0
10CORockies7488.45723.0
11MIBrewers7488.45723.0
12NYMets7488.45723.0
13PHPhillies7389.45124.0
14CHCubs6696.40731.0
15MIMarlins62100.38335.0

Spray chart

Hover, tap or use the arrow keys to see each ball in play.

51 balls in play · 21 hits · filled is a hit, hollow is an out

Strike zone

Hover, tap or use the arrow keys to see each pitch.
  • Ball
  • Called strike
  • Swinging strike
  • Foul
  • In play

Catcher's view. Count is after the pitch.

Game info

Venue
Oracle Park, San Francisco, CA