
































Skip to content

Los Angeles Dodgers at Atlanta Braves

1
2
3
4
5
6
7
8
9
RHE
LAD0000400015140
ATL20021200—7110

Game flow

ATL100%50%100%LAD
123456789

Biggest lead ATL by 4

Key plays

  • B1 +16% ATLNick Markakis homers (1) on a fly ball to center field. Cameron Maybin scores.LAD 0 · ATL 2
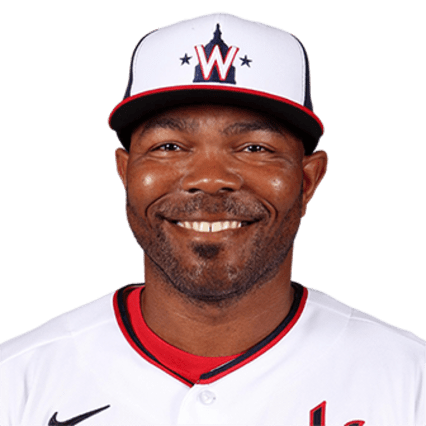
  • T5 +11% LADHowie Kendrick doubles (17) on a sharp line drive to center fielder Cameron Maybin. Alex Guerrero scores. Joc Pederson scores.LAD 2 · ATL 4
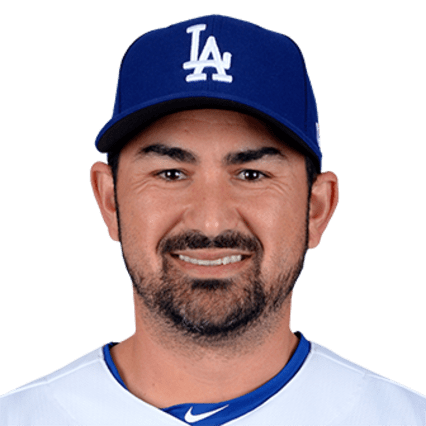
  • T5 +22% LADAdrian Gonzalez homers (21) on a fly ball to right center field. Howie Kendrick scores.LAD 4 · ATL 4
  • T9 +13% LADJoc Pederson singles on a ground ball to right fielder Nick Markakis. Austin Barnes to 3rd. Yasmani Grandal to 2nd.LAD 4 · ATL 7
  • T9 +25% ATLHowie Kendrick grounds into a double play, shortstop Andrelton Simmons to second baseman Jace Peterson to first baseman Joey Terdoslavich. Austin Barnes scores. Yasmani Grandal to 3rd. Joc Pederson out at 2nd. Howie Kendrick out at 1st.LAD 5 · ATL 7

Team stats

  • 14Hits11
  • 5Runs7
  • 1Home runs1
  • 0Walks4
  • 2Strikeouts5
See more
  • 0Stolen bases1
  • .359Batting average.324
  • .359On-base %.395
  • .487Slugging.559
  • 7.88ERA5.00
  • 15Left on base11

2015 National League Standings

WLPCTGB
1STCardinals10062.617—
2PIPirates9864.6052.0
3CHCubs9765.5993.0
4LADodgers9270.5688.0
5NYMets9072.55610.0
6SFGiants8478.51916.0
7WSNationals8379.51217.0
8AZD-backs7983.48821.0
9SDPadres7488.45726.0
10MIMarlins7191.43829.0
11CORockies6894.42032.0
12MIBrewers6894.42032.0
13ATBraves6795.41433.0
14CIReds6498.39536.0
15PHPhillies6399.38937.0

Spray chart

Hover, tap or use the arrow keys to see each ball in play.

66 balls in play · 25 hits · filled is a hit, hollow is an out

Strike zone

Hover, tap or use the arrow keys to see each pitch.
  • Ball
  • Called strike
  • Swinging strike
  • Foul
  • In play

Catcher's view. Count is after the pitch.

Game info

Venue
Turner Field