










































Skip to content

Kansas City Royals at New York Mets

1
2
3
4
5
6
7
8
9
RHE
KC000010000170
NYM10010000—261

Game flow

NYM100%50%100%KC
123456789

Biggest lead NYM by 2

Key plays

  • B1 +10% NYMAsdrubal Cabrera homers (7) on a fly ball to left center field.KC 0 · NYM 1
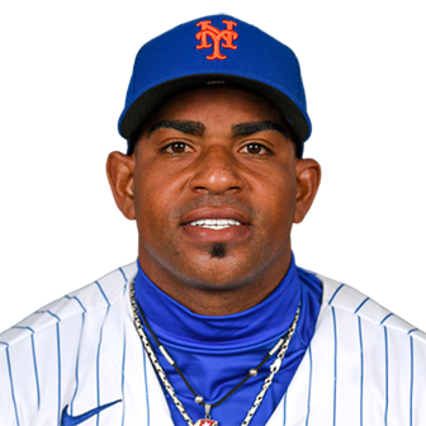
  • B4 +10% NYMYoenis Cespedes homers (18) on a fly ball to center field.KC 0 · NYM 2
  • T5 +12% KCBrett Eibner singles on a ground ball to left fielder Michael Conforto. Paulo Orlando scores. Cheslor Cuthbert to 2nd.KC 1 · NYM 2
  • T5 +10% NYMWhit Merrifield strikes out swinging.KC 1 · NYM 2
  • T9 +7% NYMBrett Eibner strikes out swinging.KC 1 · NYM 2

Team stats

  • 7Hits6
  • 1Runs2
  • 0Home runs2
  • 1Walks2
  • 11Strikeouts6
  • 0Errors1
See more
  • .206Batting average.200
  • .229On-base %.273
  • .235Slugging.433
  • 2.25ERA1.00
  • 16Left on base10

2016 Standings

American LeagueWLPCTGB
1TERangers9567.586—
2CLGuardians9467.5840.5
3BORed Sox9369.5742.0
4BAOrioles8973.5496.0
5TOBlue Jays8973.5496.0
6DETigers8675.5348.5
7SEMariners8676.5319.0
8HOAstros8478.51911.0
9NYYankees8478.51911.0
10KCRoyals8181.50014.0
11CWWhite Sox7884.48117.0
12LAAngels7488.45721.0
13OAAthletics6993.42626.0
14TBRays6894.42027.0
15MITwins59103.36436.0
National LeagueWLPCTGB
1CHCubs10358.639—
2WSNationals9567.5868.5
3LADodgers9171.56212.5
4NYMets8775.53716.5
5SFGiants8775.53716.5
6STCardinals8676.53117.5
7MIMarlins7982.49124.0
8PIPirates7883.48525.0
9CORockies7587.46328.5
10MIBrewers7389.45130.5
11PHPhillies7191.43832.5
12AZD-backs6993.42634.5
13ATBraves6893.42235.0
14CIReds6894.42035.5
15SDPadres6894.42035.5

Spray chart

Hover, tap or use the arrow keys to see each ball in play.

47 balls in play · 13 hits · filled is a hit, hollow is an out

Strike zone

Hover, tap or use the arrow keys to see each pitch.
  • Ball
  • Called strike
  • Swinging strike
  • Foul
  • In play

Catcher's view. Count is after the pitch.

Game info

Venue
Citi Field, Flushing, NY