

























Skip to content

Cincinnati Reds at San Francisco Giants

Game flow

SF100%50%100%CIN
123456789

Biggest lead CIN by 3 · SF by 2 · 1 lead change

Key plays

  • T3 +21% CINEugenio Suarez homers (7) on a fly ball to left center field. Jesse Winker scores.CIN 2 · SF 0
  • B4 +10% SFBrandon Belt homers (8) on a fly ball to right field.CIN 3 · SF 1
  • B4 +11% SFAustin Jackson singles on a line drive to right fielder Scott Schebler. Evan Longoria to 3rd. Brandon Crawford to 2nd.CIN 3 · SF 1
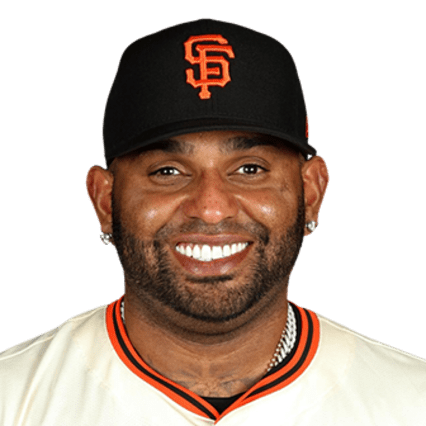
  • B4 +17% SFPablo Sandoval singles on a ground ball to left fielder Jesse Winker. Evan Longoria scores. Brandon Crawford scores. Austin Jackson to 2nd.CIN 3 · SF 3
  • T8 +9% CINEugenio Suarez doubles (7) on a sharp line drive to left fielder Gregor Blanco.CIN 3 · SF 4

Team stats

  • 7Hits11
  • 3Runs5
  • 1Home runs1
  • 1Walks1
  • 9Strikeouts8
  • 0Errors1
See more
  • .219Batting average.314
  • .265On-base %.333
  • .375Slugging.429
  • 5.63ERA1.00
  • 8Left on base15

2018 National League Standings

WLPCTGB
1MIBrewers9667.589—
2CHCubs9568.5831.0
3LADodgers9271.5644.0
4CORockies9172.5585.0
5ATBraves9072.5565.5
6STCardinals8874.5437.5
7PIPirates8279.50913.0
8AZD-backs8280.50613.5
9WSNationals8280.50613.5
10PHPhillies8082.49415.5
11NYMets7785.47518.5
12SFGiants7389.45122.5
13CIReds6795.41428.5
14SDPadres6696.40729.5
15MIMarlins6398.39132.0

Spray chart

Hover, tap or use the arrow keys to see each ball in play.

51 balls in play · 18 hits · filled is a hit, hollow is an out

Strike zone

Hover, tap or use the arrow keys to see each pitch.
  • Ball
  • Called strike
  • Swinging strike
  • Foul
  • In play

Catcher's view. Count is after the pitch.

Game info

Venue
Oracle Park, San Francisco, CA