



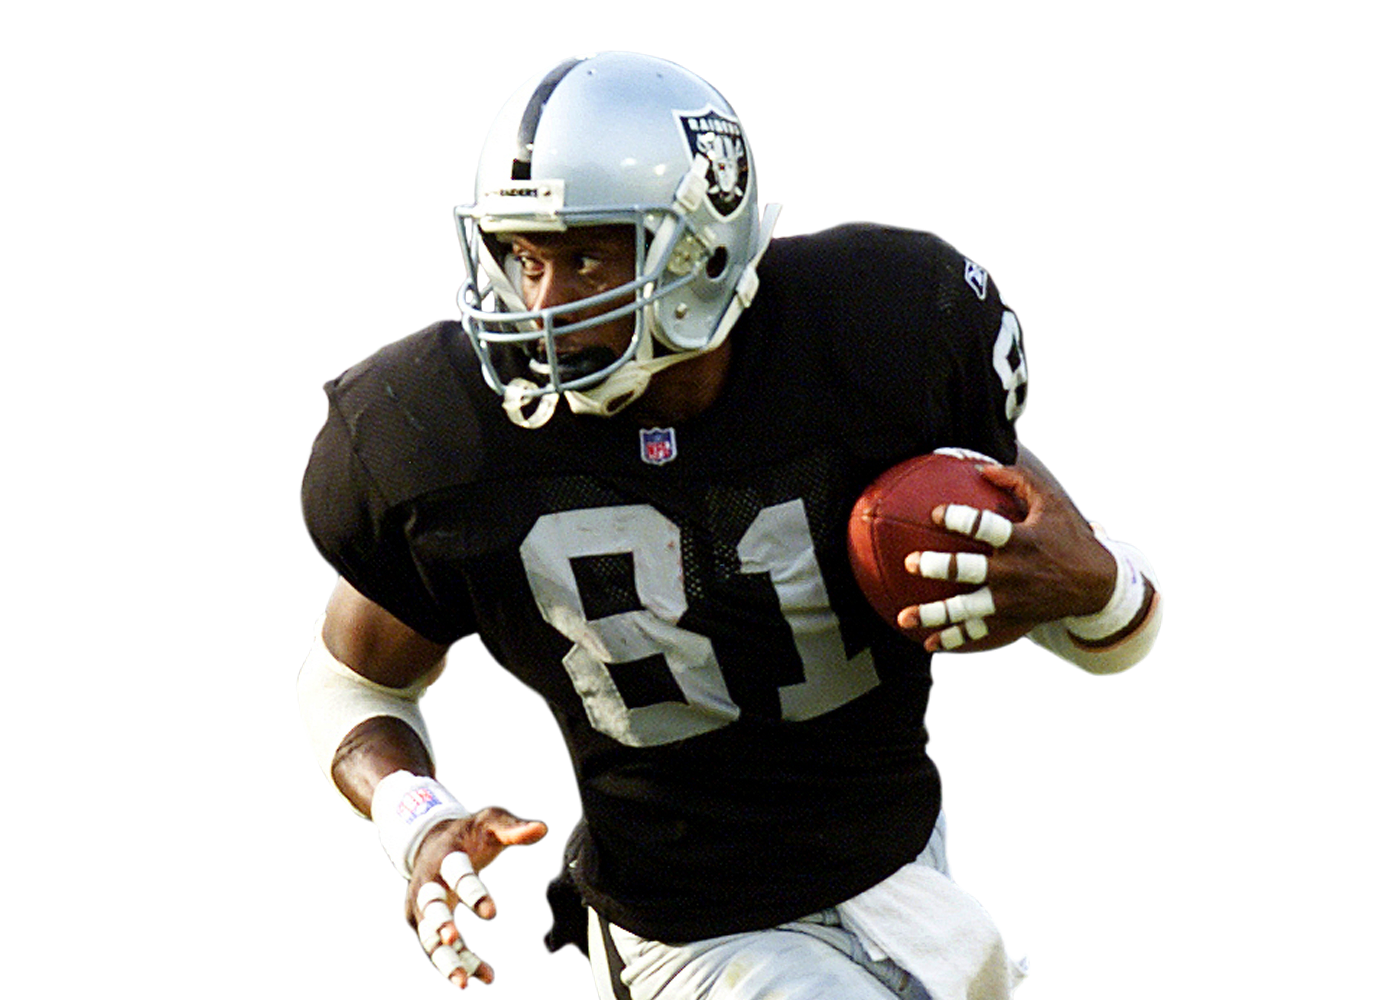


























Buccaneers outlast Raiders 20-17 behind Dilfer's 192 passing yards
The Buccaneers outlasted the Raiders 20-17 in overtime at home.
Trent Dilfer threw for 192 yards with 2 touchdowns and 1 interception for the Buccaneers, and Errict Rhett ran for 95 yards. Jeff Hostetler threw for 181 yards with 1 touchdown and 1 interception for the Raiders, and Napoleon Kaufman ran for 32 yards.
The Buccaneers took the lead for good with 3:11 left in OT.
Players mentioned
Written by StatPro from the box score and play-by-play.